Experiment Info
| Planted: | 9/24 |
| Variety: | Red Devil |
| Population: | 1.85 million |
| Row Spacing: | 7.5″ |
| Previous Crop: | Navy Beans |
| Plot Size: | 15′ x 265′ |
| Replications: | 4 |
| Liquid BC: | 4/5 |
| Topdress: | 7/16 |
Soil Test Values (ppm)
| pH: | 6.7 |
| CEC: | 12.4 |
| % OM: | 2.8 |
| Bray P1: | 15 |
| K: | 132 |
| S: | 6 |
| % K: | 2.7 |
| % Mg: | 21.2 |
| % Ca: | 75.9 |
| % H: | 0 |
| % Na: | 0.2 |
| Zn: | 1.2 |
| Mn: | 5 |
| B: | 0.5 |
| Yield Goal: | 100 bu |
| Target Fertilizer Rate: |
120-113-15 |
Objective:
To compare fertilizer program rates and sources for winter wheat.
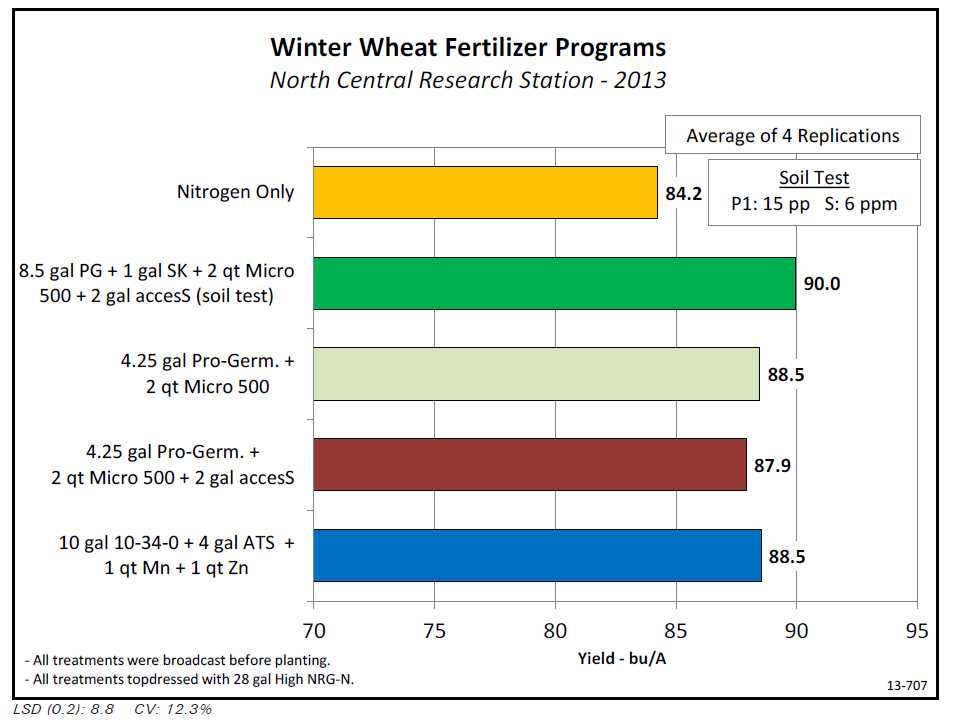
Fall applied fertilizer programs have been researched for a number of years at the NCRS. Comparisons of a soil test program to a basic program of Pro-Germinator and Micro 500 have been tested the last 5 years to determine the importance of following a soil test. In this year’s experiment , a soil test program of 8.5 gal/A Pro-Germinator, 1 gal/A Sure-K, 2 qt/A Micro 500 and 2 gal/A access was compared to 4.25 gal/A Pro-Germinator with 2 qt/A Micro 500. These programs were also compared to a conventional fertilizer program of 10-34-0, ATS, Manganese and Zinc. Yield results appear on the chart below.
 Conclusions:
- All fertilizer treatments increased wheat yield over the nitrogen only treatment.
- Although the soil test program did have a higher yield than the other fertilizer programs, it was not statistically significant. Similar treatments have been evaluated in the past at the NCRS with a 2 bu average yield advantage to the soil test program. In all cases, the additional fertilizer costs were not covered by the yield increase.
- The addition of access to the fertilizer program did not influence yield.
- The conventional program yielded similar to the other fertilizer programs.